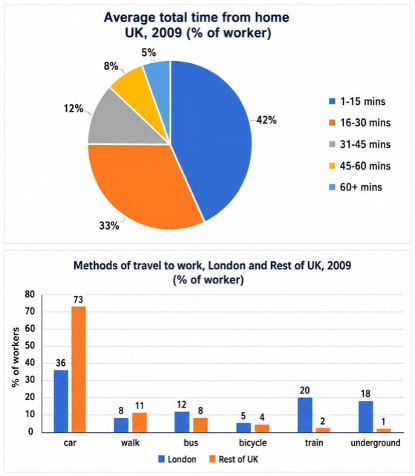
The pie chart shows the amount of time British workers spent travelling from home to work in 2009, while the accompanying bar chart focuses on the modes of transport used in London and the rest of the UK.
Overall, the majority of people’s commute lasted from 1 to 15 minutes, whereas commutes lasting more than an hour were the least common. As for transport preferences, cars were the most popular mode of transport both in the capital and outside of it. More workers in London relied on public transport compared to their counterparts in the rest of the UK who preferred more cars and walking.
Looking at the pie chart first, commuting times were relatively short for most UK workers, with 42% spending around 1-15 minutes. This was followed by the 16-30-minute trips, which accounted for 33%. This figure was almost three times greater than the proportion of individuals whose journeys lasted 31-45 minutes, at 12%. There was a three-percentage-point gap between the 45-60-minute trips and journeys that lasted more than 60 minutes, comprising 8% and a mere 5%, respectively.
In terms of the methods of travelling, most people chose cars for commuting, with a staggering 73% of people outside London preferring them versus 36% from London. Similar pronounced differences were observed in train and underground, but it was London residents who exhibited a higher share, demonstrating 20% and 18% compared to the corresponding figures of 2% and 1% for the rest of the UK. By contrast, the remaining categories showed somewhat close rates. The percentage of individuals relying on buses and walking constituted around 10%, whereas cycling made up a lower share of 4-5%.
Estimated band — 8.0
#report
#classwork
The pie chart shows the amount of time British workers spent travelling from home to work in 2009, w

Nozima Qadamova | 9.0
@nozima_writesListening/Reading 9 Writing/ Speaking 9 IELTS 9 To register for offline courses @nteacher_check No advertising service available!
14,215 subscribers
Open in Telegram